Imagine a company collects plenty data on their customers (100+ different types). With this information, the company would like to group their customers, preferably shown in a visualization that’s easy to understand. They decide to outsource this problem to you. You are given a table with 100,000 customers and 1000 different types of information (variables) for each customer.
What do you do?
You can try to compare all 1000 variables for all 100,000 customers one-by-one, but this is an impossible tasks. There are simply way too many variables (or dimensions) to look at.
This brings us to the Curse of Dimensionality, which tells us that as the number of dimensions in our data increase, the distance between our data points become almost equal. This is important! This means it’ll only get harder and harder to differentiate customers from one another,.
What if you could reduce the number of variables to 2 instead? Comparing two numbers is far more reasonable, compared to 1000.
If only we had a method to reduce the number of variables…
There are generally two ways: (1) Feature Selection, where you choose the top N most impactful variables based on what you’re trying to understand (in our case, how customers can be similar/dissimilar), or (2) Dimensionality Reduction, where you try to represent the information from all variables in fewer number of dimensions.
We will be focusing on the latter (Dimensionality Reduction). Introduce… Principal Component Analysis (PCA)!
The goal of Principal Component Analysis is to reduce the number of dimensions, while retaining as much useful information from the original data as possible.
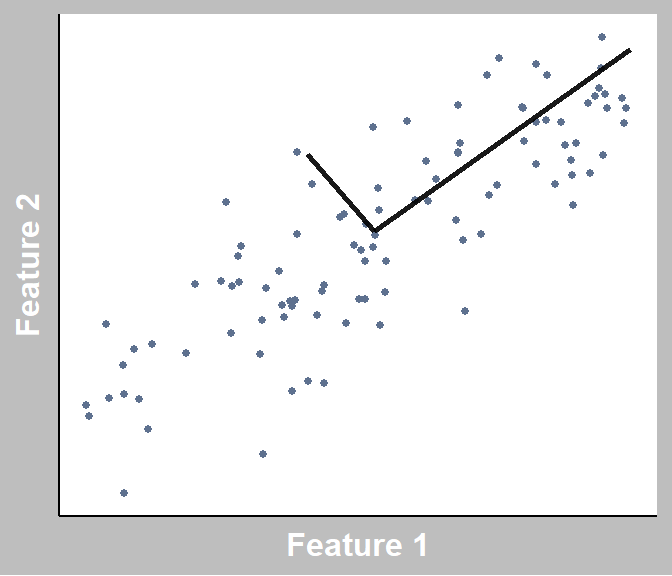
To build intuition, let’s use the graph below as an example.
Here, we have 2 features. NOTE: “Feature” = “Variable” = “Dimension”. Each data point represents an observation (a customer).
When performing PCA, imagine multiple lines are placed at the centre of all the data points. Imagine rotating each, and every time that you rotate it, it changes how far each data point is from the line (also called squared distances). We would like to minimize this for each line we place, but with the restraint that each line has to be orthogonal to one another (i.e., perpendicular for 2 lines).
To sum up the steps simply:
Find lines that capture the most amount of variation (information), and this line is known as a principal component!
Project each data point to its closest point on each of the lines.
Take the top K principal components and drop the rest.
Notice how these principle components (lines) can no longer be interpreted as simply as Feature 1/2, so we lose interpretability of each individual line. This is a drawback of using this method. However, we gain a lot from performing dimensionality reduction. Less dimensions means (1) it could be plotted, (2) less compute is needed to train models or store the transformed data.
We provide a brief example of how to perform PCA on your data in Python.
import pandas as pd
from sklearn.decomposition import PCA


def reduce_dim(X, dims=2) -> pd.DataFrame:
    """
    Given a dataframe with n variables and m rows, perform PCA
    and project X to reduce the dimensionality.

    Parameters
    ----------
    X : pd.Dataframe or array-like
      A table of (n columns x m rows).
    dims: int
      The desired number of variables (i.e. dimensionality)
      after transforming <X>.

    Returns
    -------
    pd.DataFrame
      The input X projected onto (<dims> columns x m rows).
    """
    pca = PCA(n_components=dims)
    X_transformed = pd.DataFrame(pca.fit_transform(X))
    return X_transformed
StatQuest has a great video explaining PCA in great detail!
Thanks for reading!